


 536 / 652

7.
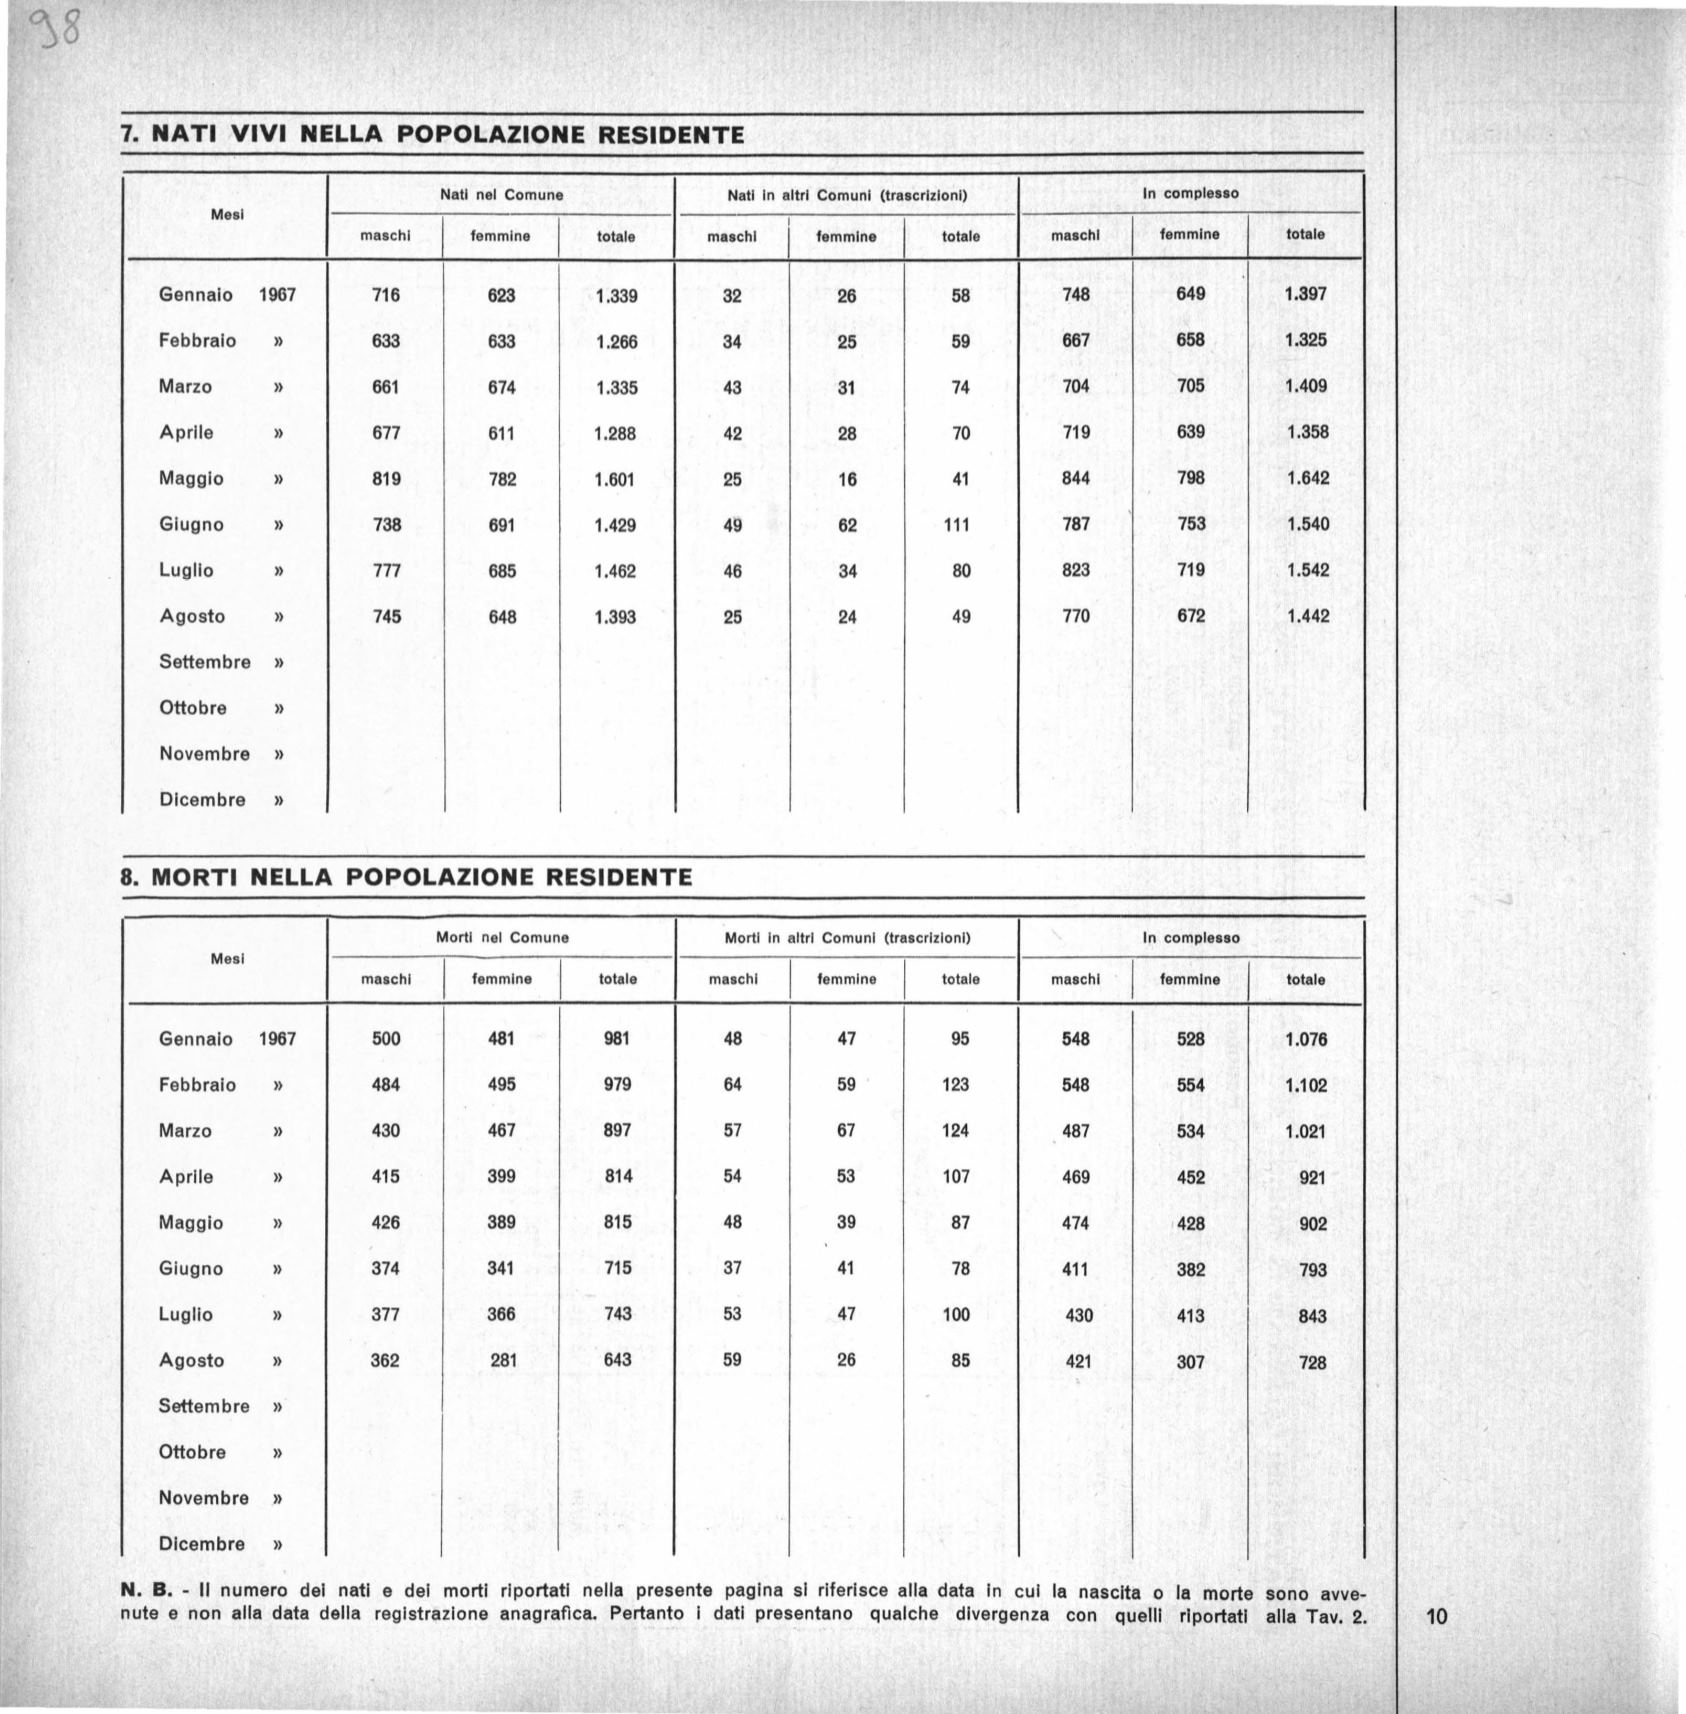
NATI VIVI NELLA POPOLAZIONE RESIDENTE
Nati nel Comune
Nati In altri Comuni (trascrizioni)
In complesso
Mesi
I
I
I
I
I
maschi
femmine
totale
maschi
I
femmine
totale
maschi
femmine
totale
Gennaio
1967
716
623
1.339
32
26
58
748
649
1.397
Febbraio
»
633
633
1.266
34
25
59
667
658
1.325
Marzo
»
661
674
1.335
43
31
74
704
705
1.409
Aprile
»
677
611
1.288
42
28
70
719
639
1.358
Maggio
»
819
782
1.601
25
16
41
844
798
1.642
Giugno
»
738
691
1.429
49
62
111
787
753
1.540
Luglio
»
777
685
1.462
46
34
80
823
719
1.542
Agosto
»
745
648
1.393
25
24
49
770
672
1.442
Settembre
»
Ottobre
»
Novembre
»
Dicembre
»
8.
MORTI NELLA POPOLAZIONE RESIDENTE
Morti nel Comune
Morti In altri Comuni (trascrizioni)
In complesso
Mesi
I
I
I
I
I
I
maschi
femmine
totale
maschi
femmine
totale
maschi
femmine
totale
Gennaio
1967
500
481
981
48
47
95
548
528
1.076
Febbraio
»
484
495
979
64
59
123
548
554
1.102
Marzo
»
430
467
897
57
67
124
487
534
1.021
Aprile
»
415
399
814
54
53
107
469
452
921
Maggio
»
426
389
815
48
39
87
474
,428
902
Giugno
»
374
341
715
37
41
78
411
382
793
Luglio
»
377
366
743
53
47
100
430
413
843
Agosto
»
362
281
643
59
26
85
421
307
I-
728
Settembre
»
,
Ottobre
»
Novembre
»
Dicembre
»
N.
B. - Il numero dei nati e dei morti riportati nella presente pagina si riferisce alla data in cui la nascita o la morte sono avve-
nute e non alla data della registrazione anagrafica. Pertanto i dati pres.entano qualche divergenza con quelli riportati alla Tav. 2.
10